U.S. Wildfire Cost-Plus-Loss Economics Project:
The “One-Pager” Checklist
By Bob Zybach (a), Michael Dubrasich (b), Greg Brenner (c), John Marker (d)
Published online August 1, 2009 by Wildland Fire Lessons Learned Center
Summary
US forests have been experiencing an escalating number of catastrophic-scale forest wildfires during the past 20 years. US Forest Service and other local, State, Federal, and Tribal government wildfire suppression costs have also escalated dramatically, to nearly $2 billion/year. Preliminary research indicates that USFS suppression costs may represent only 2-10% of the total “cost-plus-loss” damages to burned forests, however; recent public losses attributable to major forest wildfires may total $20 billion to $100 billion/year (or possibly more). The “U.S. Wildfire Cost-Plus-Loss Economics Project” was founded by the four authors and other interested citizen volunteers in early 2008 to better document and publicize these losses. A comprehensive peer-reviewed wildfire cost-plus-loss ledger has been developed by the authors, and funding is currently being sought to test its functionality for the 2009 fire season. This article is intended to bring the project to public attention, define the project’s purpose and intent, and to introduce a “one-pager” checklist summary of the draft ledger that can be used by interested professionals, affected citizens, landowners, county officials, and others to begin a more comprehensive analysis of individual wildfires and their economic effects on US lives, livelihoods, structures, cultural and natural resources.
What are the actual costs of a wildfire?
Official Forest Service tallies usually include suppression expenses only. Media reports sometimes include estimates of damage to homes and infrastructure. But the economic impacts of wildfires are far-reaching, and recent research shows the need for improved cost estimates of wildfire.
The escalating frequency, severity, and costs over and above fire suppression associated with large-scale forest wildfires (1) include losses of human lives, homes, pets, crops, livestock, and long term environmental and infrastructure damage. Many destructive megafires have made international news, such as the lingering California wildfires of 2008, or the February, 2009 Australian fires, which claimed more than 200 lives and leveled several small towns.
Yet wildfire costs and losses are often considered in terms of suppression costs only, with relatively little attention given to related losses of timber and forage values, wildlife habitat and populations (including endangered species and their critically protected habitat), air and water quality, recreational opportunities, local economies, and other resources and amenities important to all citizens. Human lives and adverse health effects are usually not considered in terms of dollar losses at all, and tallies of domestic animal or wildlife fatalities are rarely attempted or even mentioned. Rarely is there any attempt to quantify the long-term consequences of a damaged renewable resource base to provide for the needs of an ever increasing present and future human society (e.g.Bowman et al. 2009).
Consideration of an inclusive and comprehensive cost-plus-loss evaluation could be a helpful exercise when evaluating suppression/readiness need and effectiveness appropriation (Rideout et. al. 2008) as well as offering a more complete picture of wildfire effects.
Large wildfires consume more than just suppression expenses (“costs”) – they also do measurable damages (“loss”) to public, private, and Tribal equity and resources. Traditional fire appraisal uses the term “cost-plus-loss” (Sparhawk 1925) to account for all the economic impacts of wildfire. This econometric analysis method is sometimes expressed as C+NVC (costs plus net value change) (Donovan and Rideout 2003). The concept of C+NVC allows for a positive value change, should that occur. The goal (economic utility) of fire suppression is to minimize cost-plus-loss, sometimes expressed as LCD (least cost plus damage) (Sparhawk 1925; Johnson and Miyanishi 2001).
We offer an operational methodology to better characterize the broader true costs to society of large-scale wildfires: typically, those fires involving loss of human life, thousands of acres in size, and/or millions of dollars of damage. This article focuses on practical uses of a “first step” tool we have developed – a one-page checklist – that can be employed by local citizens, media, fire managers, and elected officials to begin the process of better accounting for short-term and long-term effects of wildfires on US lives and economies (2). A next step is to obtain funding in order to test a comprehensive ledger that more accurately details and documents wildfire costs and losses (Dubrasich, et al. 2009), to better prioritize budgets that assure adequate levels of protection, to account for effects and consequences of wildfires, and to help wildfire, natural resource, and infrastructure managers and officials become more aware of and fully informed about the economic effects of wildfires.
To date, our own findings paint a far different picture than that commonly reported by the media or understood by the public. We have found that total short-term and long-term costs and losses attributed to wildfires typically attain amounts that are ten, 20, or even 50 times reported suppression costs. For example, the Los Angeles Times reported in December, 2008 that California wildfire suppression costs for that year had exceeded $1 billion (Boxall 2008), yet makes no mention of the 23 fatalities associated with those fires, the estimated billions in dollars in increased hospitalization and health care costs from months of exposure to wildfire smoke, the damages to agriculture, timber, and winegrape production, the thousands of people evacuated, the homes destroyed, the subsequent erosion in burned watersheds, impacts to irrigation and hydropower facilities, recreation business losses, carbon emissions, etc. The same newspaper subsequently reported that a detailed analysis of the 2003 San Diego Fires showed total wildfire-related costs and losses to be 50 or more times greater than suppression costs (Boxall 2009).
Using standard cost-plus-loss methods, our initial estimates are that total damages for the 2008 California wildfires will likely be at least $10 billion, and may eventually total $30 billion, or even more -- and that is just one State, for just one year!
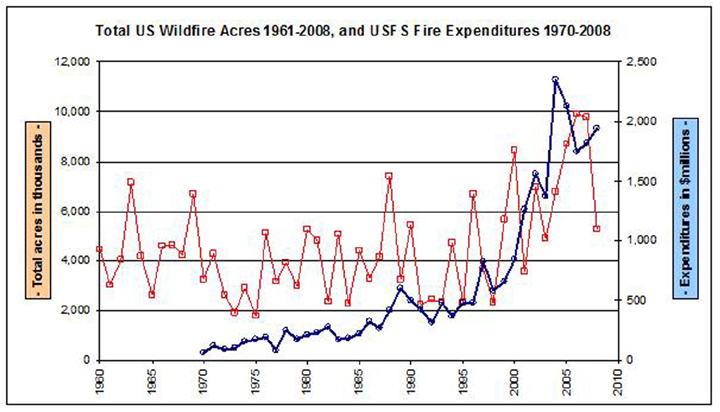
The US Forest Service has for decades simply reported numbers of wildfires, total affected acres, and suppression costs to Congress as a method of representing the costs of these events to taxpayers [see Graph 1]. Beyond suppression costs, the direct and indirect, short- and long-term damages and rehabilitation costs are given cursory mention, if at all. Again, we contend that suppression costs represent no more than 10% – at most – of actual wildfire costs to homeowners, landowners and US citizens: to all taxpayers.
We are not alone in voicing our concerns. In recent years a growing number of foresters, scientists, landowners, economists, and other concerned citizens have brought increasing attention to the disparity between reported costs of US wildfires, and the actual damages and losses (e.g., Lynch 2004; Dunn et al. 2005; Mason et al. 2006; Rahn 2009).
Some examples:
* The Western Forestry Leadership Coalition recently released a report entitled “The True Cost of Wildfire in the Western U.S.” (Dale 2009). The authors examined six major US wildfires, and compared suppression costs and tactics with “total costs.” Two examples of this process were the 2000 Cerro Grande fire in New Mexico (shown to have suppression costs that reflected only 3% of total damage estimates), and the 2003 Old, Grand Prix, and Padua fire complex in California, in which suppression costs were only 7% of total costs to date – with total losses expected to increase dramatically in years to come (Dunn et al. 2005). The report draws specific attention to the:
“millions of dollars spent to extinguish large wildfires [that] are widely reported and used to underscore the severity of these events. Extinguishing a large wildfire, however, accounts for only a fraction of the total costs associated with a wildfire event . . .""A full accounting considers long-term and complex costs, including impacts to watersheds, ecosystems, infrastructure, businesses, individuals, and the local and national economy. Specifically, these costs include property losses (insured and uninsured), post-fire impacts (such as flooding, erosion, and water quality), air quality damages, healthcare costs, injuries and fatalities, lost revenues (to residents evacuated by the fire, and to local businesses), infrastructure shutdowns (such as highways, airports, railroads), and a host of ecosystem service costs that may extend into the distant future.”
* The 2003 fires in San Diego and Southern California were a disaster by any measure – 24 fatalities, over 3,700 homes destroyed. At the time, the costs of the suppression efforts were staggering, $43 million. However, Matt Rahn, a researcher from San Diego State University, recently presented findings that put this figure at less than 2% of the total long-term cost of the fire (Rahn 2009).
* The Hayman Fire (2002) burned 138,000 acres and cost $42,279,000 ($307/acre) to suppress. But Professor Dennis Lynch of Colorado State University estimated that an additional $187,500,000 ($1,358/acre) in losses had accrued within a year. Suppression costs were only 18% of the total, and Dr. Lynch stated, “I recognized the need to follow costs into subsequent years to more completely identify a fire’s true impact” (Lynch 2004).
* The USDA Forest Service Rocky Mountain Research Station began issuing a six-volume series of General Technical Reports in 2000 titled “Wildland Fire in Ecosystems” (e.g., Smith et al. 2000; Zouhar et al. 2008) that individually examined current information regarding wildfire effects on plants, animals, cultural resources, soil, water, air, and weeds. Cumulative economic effects weren’t considered, but the comprehensive assessment of actual wildfire damages to natural resources was unprecedented.
* The National Association of Forest Service Retirees issued “Forest Health and Fire: An Overview and Evaluation” (Pfilf et al. 2002) that documented and analyzed the recent historic increases in US wildfire occurrences and severity. The report called for a detailed accounting of “total losses associated with fire and other forest health situations,” specifically mentioning homes, evacuations, insurance claims, natural resources, recreation, water, forest health, timber, habitat, wildlife, management costs, subsequent increases of insects and disease.
* An Independent Panel chartered by the U.S. Secretary of Agriculture produced a report titled "Towards a Collaborative Cost Management Strategy: 2006 U.S. Forest Service Large Wildfire Cost Review Recommendations" that studied the 19 fires on 16 National Forests requiring more than $10 million each in suppression costs for the 2006 fire season (Hyde and Schmidt 2007). One of the purposes of the report was to address cost-savings management issues and potential strategies to impact fire suppression costs at strategic levels. A “final note” on metrics needed to quantify fire suppression efforts came to three conclusions: 1) existing cost per acre burned measures were “totally inadequate to gauge large wildfire outcomes”; 2) there were “too many differing definitions of fire severity” to adopt it as a useful measure; and 3) “analyzing the outcome of a large wildfire must also consider how the forest has changed with regard to desired future condition of the forest.” The panel concluded that as national and regional fire organizations develop more desirable suppression strategies “it will be all the more critical to develop a better set of fire outcome measures.” (The panel did not recommend any specific measures however, and that remains a task undertaken by our U.S. Wildfire Cost-Plus-Loss Economics Project.)
* In July of 2008 Union Pacific Railroad settled a civil lawsuit brought by the US Forest Service to recover damages connected with the 2000 Storrie forest fire in the Plumas and Lassen National Forests in Northern California. Fire suppression costs were $22 million, but the settlement was for $102 million, roughly 5 times more. The U.S. District Court of Eastern California ruled that government was entitled to compensation for the unique aspects of the damaged forests, above and beyond the fair market value of the timber destroyed. The area burned included old-growth forests that Congress expressly set aside for preservation by protecting them from logging. The remaining $80 million of the settlement compensates the United States for:
" ... the loss of public scenery and recreation and habitat and wildlife, rather than merely the costs of the lost timber and fire-fighting resources used to douse the blaze. ... US district judge Frank C. Damrell Jr. ruled that 'this court must consider, as many courts have, the unique character of the land at issue.' Over the railroad's objections, the judge found the government could seek damages for injuries other than to timber, including harm to the soil, destruction of trees too young for harvest, destruction of wildlife and habitat, and to the area's grandeur, as well as denial of its use for recreation. He also ruled the government could seek its reforestation costs, noting 'much of the devastated areas involved old growth forests, designated wilderness and trees that were hundreds of years old.'" (The Guardian 2008).
U.S. forests have been experiencing an escalating number of catastrophic scale forest wildfires during the past 20 years. During the same time, federal, state, and local wildfire suppression outlays have also escalated dramatically, from less than $500 million to nearly $2 billion/year. With the simultaneous reductions of active timber and recreational resources management, wildfire suppression has become “the big business” of the USFS. However, preliminary research indicates that wildfire agencies’ suppression costs may represent only 2% to 10% of the total cost-plus-loss damages to burned forests – that is, recent public losses attributable to major forest wildfires may likely, and more accurately, total anywhere from $20 billion to more than $100 billion per year.
In the Western Forestry Leadership Coalition report mentioned above, the authors examined the Cerro Grande Fire. That fire was initiated by a prescribed fire set by the USDI National Park Service on the Bandelier National Monument that escaped firelines on May 2, 2000 due to high winds. It soon became a 42,900-acre wildfire that ultimately destroyed over 400 residences, caused the evacuation of 18,000 people, and did significant damage to the Los Alamos National Laboratory facilities and equipment. Lasting damage was done to soils (erosion) and hydrology (flash floods) as well as vegetation, habitat, and historic cultural sites. The fire cost $33.5 million to contain, inflicted $864.5 million in direct costs, and required $72.5 million in short-term rehabilitation costs. Despite these reported damages, it is stated, “longer-term costs are still likely under-reported.”
The Old, Grand Prix, and Padua wildfire complex consisted of about a dozen separate fires, some of which are believed to have been started by arsonists, in the Santa Ana Mountains of southern California. The fire complex eventually totaled about 125,000 acres in size, at least six people were killed, about 100,000 residents were evacuated, 787 property owners filed claims for total losses, and 3,860 filed claims for partial losses attributed to the fire. More than $61 million was spent on suppression, but other direct costs totaled $650 million, and $122 million was spent on short-term “rehabilitation.” Despite these totals, the Western Forestry Leadership Coalition report stated:
“ Non market costs were listed and noted as important, but were not included in total cost estimates. Likewise, the authors concluded valuation of ecological goods and services a work in progress and did not build these values into cost estimates. … Eighteen months following the fire, $832 million had been spent; authors estimated an additional $443 million would be spent in the future as part of long-term fire recovery efforts." (Dale 2009).
The purpose of this article is to bring our wildfire cost-plus-loss economics project to public attention and to introduce a “one-pager” checklist summary our draft ledger. This checklist is intended to be used by interested professionals, landowners, affected citizens, government officials, media, and others to guide analysis of individual wildfires and their inclusive negative effects on lives, properties, and cultural and natural resources (including their future availability). We use comprehensive “cost-plus-loss” accounting methods and consider direct, indirect, and post-fire costs and losses.
We have developed eleven separate ledger categories
of costs and losses that are reflected in the general
ledger,
and
these same
categories are
listed
in the “one-pager” checklist (see
Table 1), as further
described in the following. Within each ledger
category,
costs and losses are characterized
as direct, indirect, and post-fire.
Direct costs. These are the amounts spent directly
controlling a wildfire (suppression) and wildfire-related
expenses,
such as evacuations, commerce
disruption, equipment
damage, burnt homes, cars, and personal property,
school and playground closures, additional air quality
monitoring,
public
health alerts,
or other costs directly
related (and generally concurrent) to the fire.
Indirect costs. These have been typically over-looked in accounting for wildfire damages in earlier reports. Indirect costs include amortized wildfire preparedness expenditures such as crew training costs, equipment and supply outlays and depletion planning, and fire insurance premiums. Damage to capital investments such as recreational structures, devalued experiences, investments in forest management (reforestation, thinning) agriculture (crop establishment and treatments), past property taxes, reduced air and water quality, and changed landscape aesthetics are other indirect costs. This category considers indirect costs that are concurrent to a wildfire; i.e., accrued as the fire occurs.
Post-fire costs. These are the long-term damages (losses), direct and indirect, to society and the environment. These include capital value losses to timber, agriculture, homes, and other public and private equity. Some post-fire losses can be difficult to quantify, and may only become apparent over time. Long-term human health effects, increased costs of medical care, reduced property values due to wildfire smoke damage, rehabilitation costs for publicly and privately damaged facilities, negative impacts on affected livelihoods, and sediment management costs in reservoirs subjected to increased soil erosion are examples of post-fire costs that may be attributed to specific wildfire events. Yet to be fully documented are wildfire smoke emission effects on possible climate change (3).
These are the eleven categories, with basic definitions, that are used in the checklist “one-pager,” and in the comprehensive ledger:
1. Suppression costs. These costs are the ones most commonly reported by media (to the exclusion of other costs and losses) and are often under-reported at that. Typical costs include wages, transportation, equipment, services, supplies, etc. Special costs, such as equipment depreciation, communications interruptions, and emergency evacuations, need to be accounted for, as well. Indirect suppression costs include emergency preparedness measures, supply purchases, crew training, and equipment maintenance. Post-fire costs and losses include equipment repair, supplies replacement, formal reviews, and possible medical treatments and hospitalization of personnel.
2. Property. Damage and destruction to federal, state, county, private, and municipal structures and facilities are major losses attributed to wildfires, particularly when transportation networks and communications systems are considered. Damage to timber and agricultural crops are other direct property losses. Some structural losses to private property may be insured; these can include business properties and homes, vehicles, and livestock. Capital goods and equipment damage and depreciation, evacuation expenses, and other losses are directly related to fire and smoke damage. Indirect losses include pre-fire insurance premium payments, building and landscape maintenance expenses, firefighting equipment purchases, and fire-related business closures. Post-fire losses include salvage, clean-up, rehabilitation, and repair expenses, equipment and capital goods replacement, drinking water pollution, smoke damage, deflated real estate values, lost sales tax revenues, and fire insurance premium increases.
3. Public health. These are some of the most
overlooked and potentially costly areas associated
with wildfire
(and resultant
smoke) damage.
In addition
to fatalities, wildfire smoke inhalation
is known to cause and exacerbate a wide
range of human
health problems, including asthma, emphysema,
and heart disease. Medical equipment, health-related
evacuations,
ambulance
charges, and hospitalization
are some
of the direct health
losses related to wildfire. Indirect losses
include health insurance premiums, pre-fire
medical equipment
purchases,
and medical personnel
training. Post-fire
losses include long-term health effects and
increased health care expenses, insurance
premium adjustments,
health-related
work absenteeism,
survivor
benefits, and
even funeral and burial costs.
4. Vegetation. Standing timber losses have often been considered in wildfire damage estimates, but loss of future harvests from destruction of growing stock has been less frequently accounted for. On public lands losses include destruction of forage on grazing lands, secondary forest products destruction and/or degradation, and loss or degradation of wildlife habitat (including Endangered Species populations and protected habitats). On private land vegetation losses include timber and agricultural crops burned or impacted by wildfire smoke, such as winegrapes. Indirect losses include mortality of growing stock, the pre-fire investments used to establish or maintain such stock (such as nursery or planting costs and fencing), and irrigation systems. Post-fire losses include seeding, planting, and other revegetation costs, landscape rehabilitation, lost timber growth, and related product sales, business, job, and tax losses.
5. Wildlife. In addition to mortality of forest, range, and aquatic wildlife populations, direct losses include damage and destruction to a wide variety of common or protected habitats and to such amenities as viewing areas and feeding stations. Indirect losses include damage and destruction to pre-fire habitat improvement projects, population enhancement costs, and investments in wildlife research. Post-fire costs include reduced population productivity, foregone game management income, habitat restoration expenses, and related business, job, and tax losses. The loss of listed endangered animals and their habitat is included here.
6. Water. Direct losses include water usage for suppression action, local water system shutdowns, and reductions in drinking water, hydropower, and irrigation supplies and sales. Indirect losses are related to pre-fire planning, system investments, and wildfire-related pollution control devices. Post-fire losses include degradation of domestic water, irrigation, and hydropower supplies, system repairs, administrative costs, sediment and pollution controls and mitigation, and long-term changes in water yield and watershed ability to collect and store water.
7. Air and atmospheric effects. Direct losses are related to air pollution, including particulate, noxious gases, and CO2 emissions, and visibility impacts to road and air transportation, especially if delays and/or accidents result. Indirect losses are related to public health effects, property damage, and compromised recreational opportunities. Post-fire losses include additional air pollution controls, carbon mitigation costs, added administrative overhead, and future reductions in business, job, and tax revenues.
8. Soil-related effects. Soil erosion can occur during a wildfire due to fire-induced wind, or from suppression actions. Soils can be baked, as well. Indirect losses include investments in fertilization, scientific research, and planning. Post-fire losses include decreased soil productivity, increased soil erosion, and post-fire soil rehabilitation, erosion and sediment mitigation, and project administration.
9. Recreation and aesthetics. Campground closures, evacuations, recreation-related business shutdowns, and structural assets damages and destruction are direct recreation losses attributable to wildfires. Indirect losses include pre-fire recreation-related investments by agencies, businesses, and individuals. Post-fire losses include recreational activity decline, degradation of scenic values, compromised hunting, fishing, hiking, camping, and wildlife viewing experiences, recreation-related structural repair or rehabilitation, and reduced business income, jobs, and tax revenues.
10. Energy. Direct losses include transmission line shutdowns and resultant loss of metered power sales, destruction and damage to energy production and transmission systems, and loss of biomass energy supplies. Indirect losses include pre-fire investments in energy production facilities and transmission systems and power planning costs. Post-fire losses include energy sales reductions, equipment repair, added sediment control, and future business, job, and tax revenue losses.
11. Heritage (cultural and historical resources). These losses include damage and destruction of historical resources and pre-Contact archaeological sites, loss or damage to historic cultural trail systems, ceremonial sites, and sacred sites, and heritage-related business shutdowns. Indirect losses include pre-fire public and private investments in heritage resources, including formal evaluations, research, and structural improvements. Post-fire losses include heritage site rehabilitation and repair costs, devaluation of cultural and spiritual assets, the loss of traditional uses and heritage, lost research opportunities to gather limited and fragile information, and heritage-related business, job, and tax revenue declines.
Conclusions
US wildfire events have become increasingly common, destructive, and costly during the past 20 years, and particularly since the turn of the century. During this time wildfire suppression costs have also increased dramatically. Suppression costs only represent a small portion of over-all wildfire costs and losses, however, and other direct costs, indirect losses, and post-fire costs and losses can total 10 to 50 times or more the suppression costs. Human fatalities have also increased in frequency and number during this time. A more comprehensive economic and risk analysis and awareness on the part of decision-makers and the public of wildfire cost-plus-losses is needed with land management legislative reform to help reverse these trends. We offer a one-page checklist, with definitions and rationale, for better consideration of total costs and losses attributed to individual wildfire events. This checklist is intended to make initial estimates of total fire costs, and to ultimately be used in conjunction with a more comprehensive ledger for better tracking costs and losses over time. The use of these tools will better inform residents, officials, stakeholders, and land and resource managers regarding the management of landscapes and watersheds and appropriate wildfire responses by identifying comprehensive costs and losses of wildfires.
Footnotes
(1) It is beyond the scope of this article to examine or discuss the possible causes of recent escalations in wildfire occurrences, suppression costs, or cumulative damages – only to acknowledge these facts, which are well documented in numerous publications and other media.
(2) The “U.S. Wildfire Cost-Plus-Loss Economics Project” was founded by the four authors and other interested citizen volunteers in early 2008 to better document and publicize these losses. A comprehensive peer-reviewed wildfire cost-plus-loss econometric ledger has been developed by the authors, and funding is currently being sought to test its functionality for the 2009 fire season. This article is intended to bring the project to public attention, define the project’s purpose and intent, and to introduce a “one-pager” checklist summary of the draft ledger that can be used by interested professionals, affected citizens, landowners, county officials, and others to begin a more comprehensive analysis of individual wildfires. The checklist can be used to denote “presence or absence” of costs or damages resulting from a wildfire event; to keep a “range of values” tally of cost and damage estimates; and/or to track developing and final figures as they are determined.
(3) Although we have standardized costs to dollar figures, values place on human lives, aesthetics, or pollution, as examples, are often highly subjective and difficult or impossible to quantify. Their inclusion in the checklist is simply to acknowledge their existence, and to allow for users to better consider such values in context with other wildfire impacts. A more specific example is provided by current concern with greenhouse gas emissions related to wildfire smoke. Thomas M. Bonnicksen has developed a mathematical model used for estimating the amount of greenhouse gases (CO2, CH4, N2O) emitted by forest fires (Bonnicksen 2008). Using his model, he estimated that the 66,000-acre Moonlight Fire (2007) on the Plumas National Forest generated nearly 5 million tons of greenhouse gases. How can this amount be expressed in dollar terms? Will cap-and-trade legislation currently before the US Congress affect such an evaluation? The same model was used to calculate that 40 million tons of greenhouse gases were released or will be released as the dead wood decays that resulted from the 800,000 acre Idaho Batholith fires of 2007, and that the 1.34 million acres that burned in wildfires in California in 2008 generated CO2 emissions equivalent to approximately 13 million cars driven all year. The checklist is not intended to answer these questions, but to account for them and put them in context,
References
Bonnicksen, Thomas M. 2008. The Forest Carbon and Emissions Model. The Forest Foundation, Auburn, California. Reports 1 & 2, “Overview and Technical Information”: 28 p., “Greenhouse Gas Emissions From Four California Wildfires: Opportunities to Prevent and Reverse Environmental and Climate Impacts”: 19 p.
Bowman, David M., Jennifer K. Balch, Paulo Artaxo, William J. Bond, Jean M. Carlson, Mark A. Cochrane, Carla M. DAntonio, Ruth S. DeFries, John C. Doyle, Sandy P. Harrison, Fay H. Johnston, Jon E. Keeley, Meg A. Krawchuk, Christian A. Kull, Brad Marston, Max A. Moritz, I. Colin Prentice, Christopher I. Roos, Andrew C. Scott, Thomas W. Swetnam, Guido R. van der Werf, and Stephen J. Pyne 2009. Fire in the Earth System. Science, Vol. 324, No. 5926: 481 – 484.
Boxall, Bettina 2008. “Spending to fight California wildfires tops $1 billion,” Los Angeles Times, Los Angeles, California: December 31.
Boxall, Bettina 2009. “San Diego County’s 2003 wildfire losses top $2 billion,” Los Angeles Times, Los Angeles, California: July 13.
Dale, Lisa 2009. The True Cost of Wildfire in the Western U.S. Western Forestry Leadership Coalition, Lakewood, Colorado: 16 pp.
Donovan, Geoffrey H. and Douglas B. Rideout 2003. A reformulation of the Cost Plus Net Value Change (C+NVC) model of wildfire economics. Forest Science. 49(2): 318-323
Dubrasich, Michael, Bob Zybach, Greg Brenner, and John Marker 2009. U.S. Wildfire Cost-Plus-Loss Economics Project: Long-form Accounting Ledger. In Review.
Dunn, Alex E., Armando Gonzalez-Caban, Karen Solari 2005. The Old, Grand Prix, and Padua Wildfires: How Much Did These Fires Really Cost? USDA Forest Service-Pacific Southwest Research Station, Riverside, California: 17 pp.
Johnson, Edward A. and K. Miyanishi (eds). 2001. Forest Fires: Behavior and Ecological Effects. Academic Press, San Diego, 594 p.
Hyde, Albert C. and R. Gordon Schmidt 2007. Towards a Collaborative Cost Management Strategy: 2006 U.S. Forest Service Large Wildfire Cost Review Recommendations. Brookings Center for Executive Education, Washington, DC: 63 pp
Lynch, Dennis L. 2004. What do Forest Fires Really Cost? Journal of Forestry, September.
Mason, C. Larry, Bruce R. Lippke, Kevin W. Zobrist, Thomas D. Bloxton Jr., Kevin R. Ceder, Jeffrey M. Comnick, James B. McCarter, and Heather K. Rogers 2006. Investments in Fuel Removals to Avoid Forest Fires Result in Substantial Benefits. Journal of Forestry, January/February.
Pfilf, Richard J., John F. Marker, and Robert D. Averill 2002. Forest Health and Fire: An Overview and Evaluation. National Association of Forest Service Retirees, Chantilly, Virginia: 36 pp.
Rahn, Matt. 2009. Wildfire Impact Analysis. San Diego State University, San Diego, California: 15 pp.
Rideout, Douglas B., Yu Wei, Andrew G. Kirsch, and Stephen J. Botti. 2008. Toward a Unified Economic Theory of Fire Program Analysis with Strategies for Empirical Modeling IN T. P. Holmes et al. (eds.) The Economics of Forest Disturbances: Wildfires, Storms, and Invasive Species. Springer Science, pp 361–380.
Sparhawk, W.N. 1925. Use of liability ratings in forest protection. Journal of Agricultural Research. 30: 693-792.
Smith, Jane K., L. Jack Lyon, Mark H. Huff, Robert G. Hooper, Edmund S. Telfer, and David S. Schreiner 2000. Wildland Fire in Ecosystems: Effects of Fire on Fauna. General Technical Report RMRS-GTR-42-Vol. 1, USDA Forest Service Rocky Mountain Research Station, Ogden, Utah: 83 pp.
The Guardian 2008. “US government to announce $102m forest fire settlement with railroad,” The Guardian, London, England: July 22.
Zouhar, Kristin,
Jane K. Smith, Steve Sutherland, and Matthew L. Brooks 2008. Wildland Fire in Ecosystems: Fire and Nonnative Invasive
Plants.
General Technical
Report RMRS-GTR-42-Vol. 6, USDA Forest Service Rocky Mountain Research
Station, Ogden, Utah: 355 pp.
Authors
Bob Zybach, PhD.
Program Manager, Oregon Websites and Watersheds Project, Inc.(ORWW)
Michael Dubrasich, M.S.
Executive Director, Western Institute for the Study of the Environment (W.I.S.E.)
Greg Brenner, PhD.
Managing Partner, Pacific Analytics LLC
John Marker.
Northwest Director, National Association of Forest Service
Retirees (NAFSR)
Acknowledgements
John Thomas, Jr., Consultant for forest and farm management issues.
Darrel Kenops, Retired Forest Supervisor, Willamette National Forest, CEO National Association of Forest Service Retirees.
Armando Gonzalez-Caban, Economist, Forest Fire Laboratory, USDA Forest Service.
Dave E. Calkin, Research Forester, Rocky Mountain Research Station, USDA Forest Service.
Mike Dykzeul, Director, Forest Protection, Oregon Forest Industries Council.
Charlie Fitch, Retired District Ranger, Shasta-Trinity National Forest and wildfire expert.
Ned Pence, Retired District Ranger, Payette National Forest and wildfire expert.
Sandra J. Moore, Fire Information Officer, Kaibab National Forest, USDA Forest Service
Mark Kaib, Fire Ecology, Restoration, and Planning, Southwest
Region 2, US Fish & Wildlife
Service.
Josh McDaniel, Editor, Advances in Fire Practice, Wildland
Fire Lessons Learned Center
© 2009 Oregon Websites & Watersheds Project, Inc. and Western Institute for the Study of the Environment.